Protecting & Restoring Long Island's Peconic Bays
Read our latest water quality report and learn about our new efforts to study water quality in our priority embayments where HABs remain a critical issue.
The Peconic Estuary, the expansive network of bays and waterways nestled between the North and South Forks, represents the geographic, ecological and cultural heart of the East End.
As a National Estuary Program, the Peconic Estuary Partnership (PEP) developed the 2020 Comprehensive Conservation and Management Plan (CCMP) that identifies four long-term goals. This 2020 Peconic Estuary Annual Water Quality Report tracks whether we are meeting our identified water quality targets to achieve our goals for Peconic Estuary waters. Clean water supports fish, shellfish, and wildlife ecosystem health, provides for safe recreation in and on the water, and seafood that is safe for consumption.
The Peconic Estuary Water Quality Report will enable PEP to track progress on meeting our CCMP goals for Resilient Communities Prepared for Climate Change, Clean Waters for Ecosystem Health and Safe Recreation, and Healthy Ecosystem with Abundant, Diverse Wildlife over the next decade.
PEP has set targets for Water Clarity, Chlorophyll-a, Dissolved Oxygen and Pathogens.
Water Quality Monitoring Strategy
PEP finalized The PEP Water Quality Monitoring Strategy in 2021. The Strategy includes a summary of existing water quality monitoring programs and an assessment of whether data collected by those programs can adequately track and detect changes in water quality needed to assess progress towards CCMP Goals. The Strategy also includes Next Steps to address gaps in data and/or information needed to fully assess progress towards CCMP Goals.
Water Quality Monitoring Collaborative
To ensure effective implementation of the PEP Water Quality Monitoring Strategy, the PEP has developed a Peconic Estuary Water Quality Monitoring Collaborative (WQMC) to help advise the completion of the Next Steps from 2020 through 2023 outlined in the Strategy. The Collaborative will function as a sub-committee of the Technical Advisory Committee (TAC) and is composed of main water quality monitoring programs in the Estuary- members of New York State Department of Environmental Conservation (NYSDEC), U.S. Geological Survey (USGS), Suffolk County, Cornell Cooperative Extension (CCE), and academic and non-profit groups. The WQMC utilizes data collected by our partners to evaluate water quality:
The Suffolk County Department of Health Services (SCDHS) Surface Water Monitoring
The Suffolk County Department of Health Services Bathing Beach Monitoring Program
United States Geological Survey (USGS) Orient Harbor, Riverhead and Shelter Island Continuous Water Quality Monitoring Stations
The WQMC is using the Peconic R-based open science package developed by the Tampa Bay Estuary Program to analyze and annually report on water quality in the Peconic Estuary.
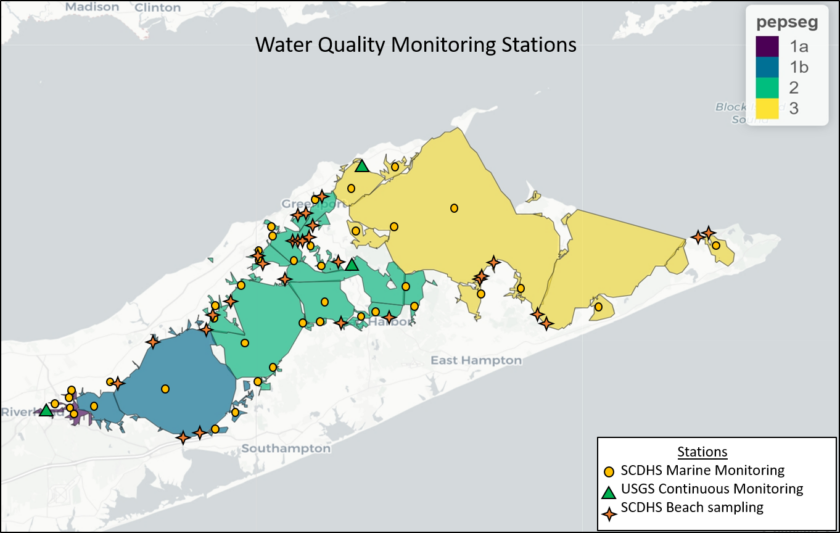

PEP will use Stop Light Graphics to indicate if the target is being met or not, and direct management action for each parameter and segment.

One of the most serious issues affecting water quality in the Peconic Estuary is excess nitrogen loading, which can cause harmful algae blooms, low dissolved oxygen, low light availability, and degraded aquatic habitats. The Report tracks water clarity, chlorophyll-a and dissolved oxygen to measure the impacts of nutrient pollution and our progress.
Water Clarity & Chlorophyll-a
Increased algae blooms correlate with higher chlorophyll-a levels and lower water clarity leading to lower light availability. The duration of time and magnitude of exceedance of water clarity and chlorophyll-a targets are assessed together to track progress toward water quality goals.
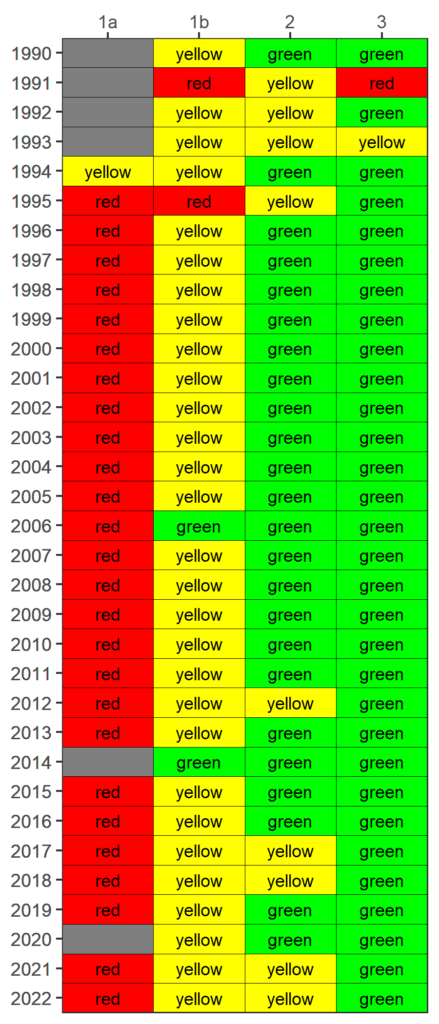
Stop Light Graphic of Combined Water Clarity and Chlorophyll-a at Peconic Estuary SCDHS Stations by Estuary Segment
1990-2022
Segments: 1a-Western-River Influence, 1b-Western, 2-Central and 3-Eastern
The Stop Light Graphic reflects the combined outcomes for chlorophyll-a and water clarity based on analysis of exceedance duration and magnitude of targets for each parameter. Water clarity and Secchi disk depth median values during the growing season at SCDHS stations were averaged within the Estuary segment. Tracking the attainment outcomes provides the framework from which Estuary management actions can be developed and initiated. For each year and segment, a color-coded management action is assigned.
Total Nitrogen
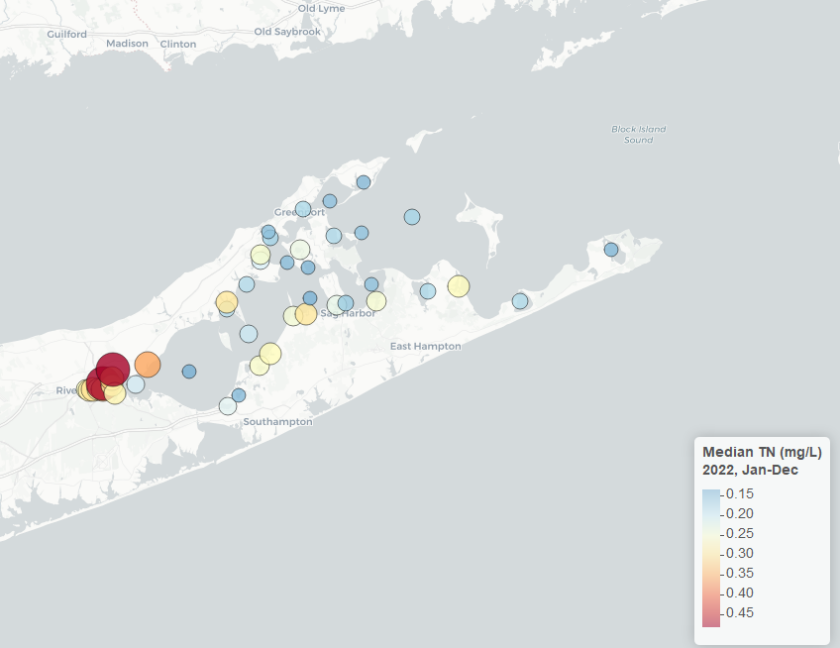
Median Total Nitrogen (TN, mg/L) at SCDHS surface water quality stations within the Peconic Estuary for 2022.
Note that Meetinghouse creek and the Sawmill Creek stations are “off the chart” based on the scale presented in the legend (0.95 mg/L and 0.63 mg/L, respectively)
Dissolved Oxygen
Stop Light Graphic of Maximum Sequential Days Monthly Below DO Concentration Target at Peconic Estuary USGS Stations
2013-2022
The Stop Light Graphic reflects the sequential number of days with a 24-hour mean measurement below 4.8 mg/L at Peconic River and Orient Harbor Stations, which is considered chronic low DO. For each month and station, a color-coded management action is assigned.

Pathogens
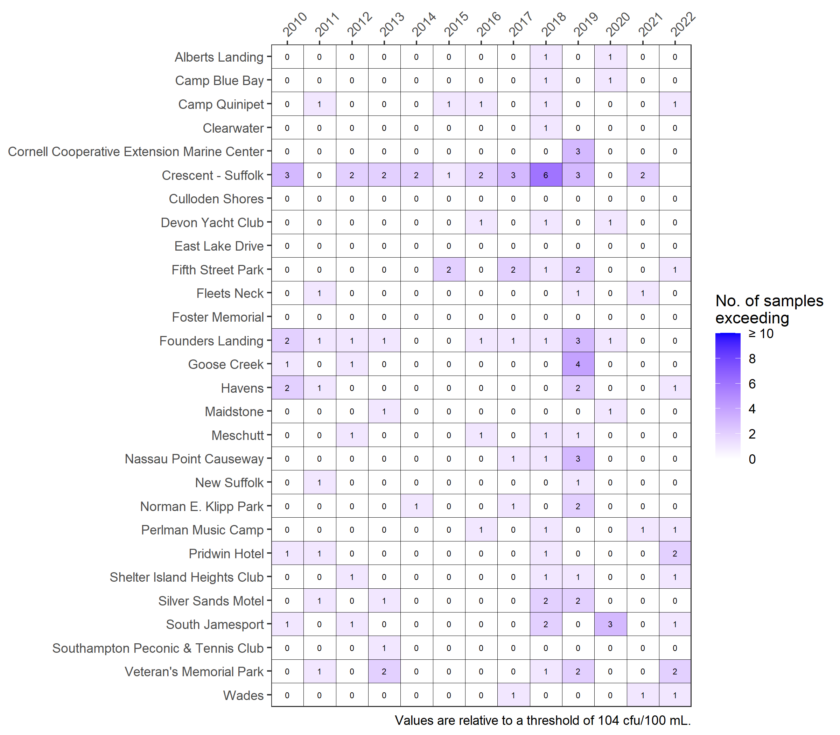
Pathogen Exposure Risk at Suffolk County Bathing Beaches in the Peconic Estuary
2010 -2022
Number of Samples that Exceeded Enterococcus Counts of 104 cfu/100 mL within 24 Hours at Bathing Beaches.
Harmful Algal Blooms
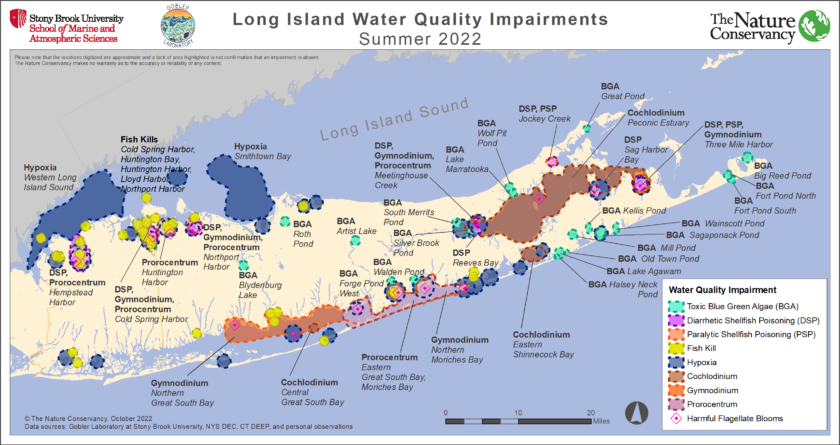
A summary of whether the PEP is meeting targets in the Estuary segments in 2021 is presented in the Report.
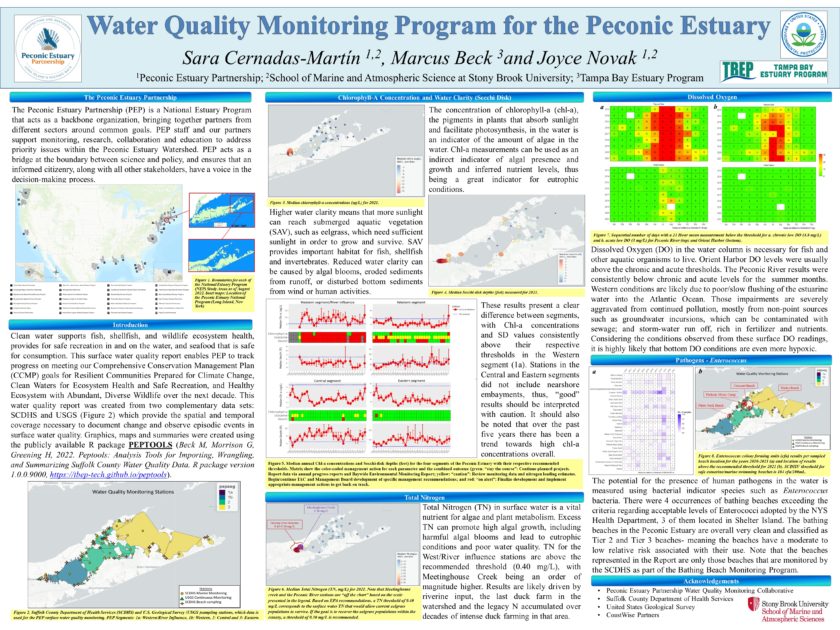
Water Quality Summary for 2021, Poster presented at the Restore America’s Estuaries conference in December 2022
Sign up for News, Events and Information straight to your inbox.

Notifications